
Inflight Ancillary Revenue Report: How Passengers Spend Their Time and Money in the Air
This report maps how airline passengers spend their time and money onboard: IFE consumption, retail conversion, payment preferences and the ancillary revenue levers that drive per-passenger yield.

The onboard opportunity: $17 billion by 2030
The inflight entertainment market is projected to reach $12.4 billion by 2030. The inflight retail market adds $5 billion on top. Together they represent a $17+ billion opportunity for airlines that understand what passengers actually do with their captive time onboard.
The IFE market doubles between 2020 and 2030. That growth is passenger-driven. 198 million EU travelers flew in Q1 2024 alone, an 11.5% increase year-on-year (Eurostat). The addressable audience is expanding. The question is whether the onboard infrastructure captures their attention and spending.
What passengers actually do in the air
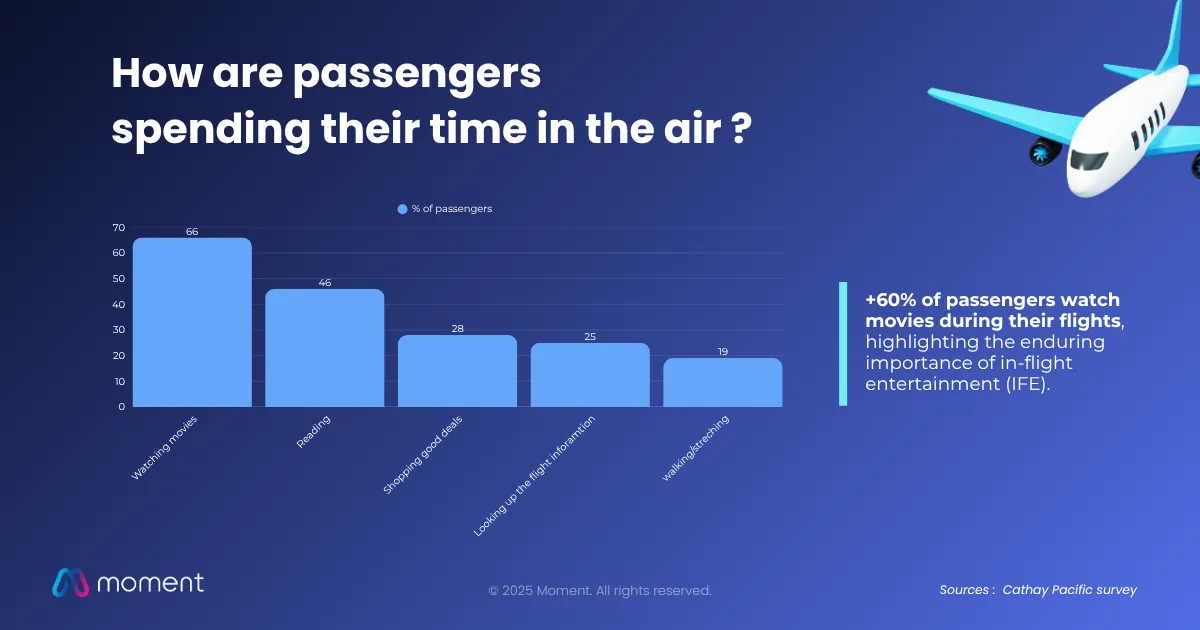
66% of passengers watch movies during their flight (Cathay Pacific survey). 46% read. 28% shop for deals. 25% check flight information.
Entertainment is the default behavior across route types and cabin classes, not a preference. The demographic profile reinforces this. 63% of air travelers are between 30 and 50 years old, a generation with strong purchasing power, high digital literacy, and expectations shaped by ground-based streaming and e-commerce. They bring those expectations onboard.
94.7% of passengers use their own devices
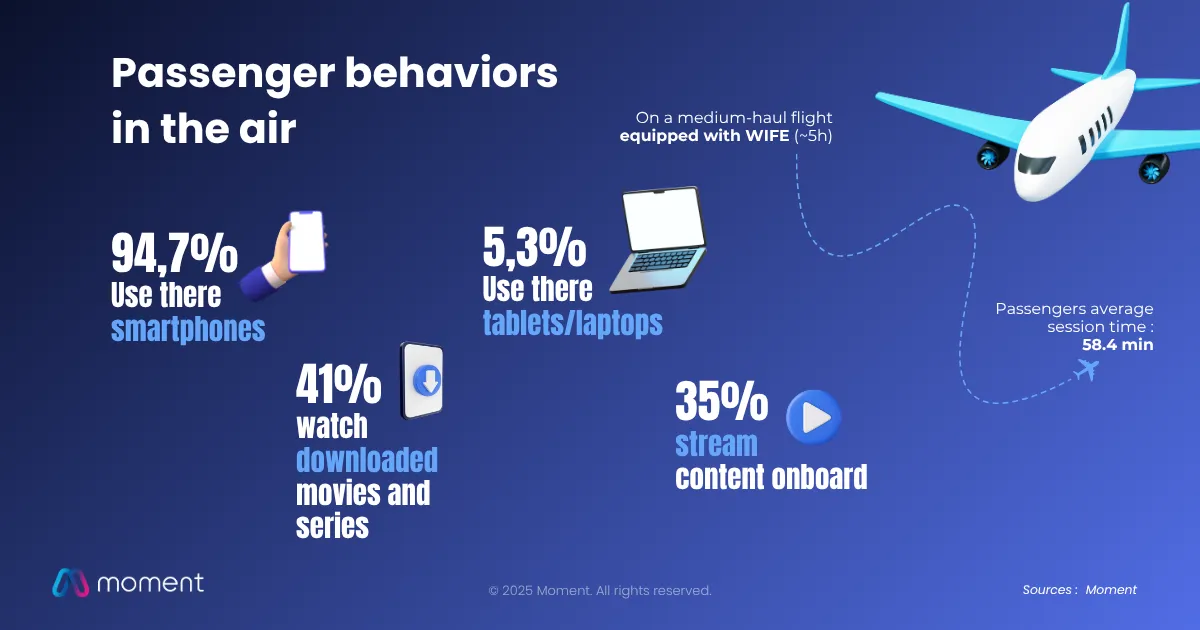
The BYOD shift is structural. 97% of passengers prefer using their own device for inflight entertainment. On flights equipped with wireless IFE, real usage data confirms this: 94.7% connect via smartphone, 5.3% via tablet or laptop.
On a medium-haul flight equipped with wireless IFE, average session time is 58.4 minutes. 41% watch downloaded movies and series. 35% stream content onboard.
The BYOD model creates one structural friction point: 59% of passengers cite the lack of charging outlets as a significant barrier. A passenger without battery is not browsing the onboard retail catalog. Charging access and seamless onboard connectivity are commercial infrastructure, not passenger amenities.
What passengers consume onboard
72% of passengers choose VOD as their primary content format. Movies and series dominate viewing time. Blockbusters consistently outperform niche content regardless of platform quality.
Hollywood catalog depth is not a differentiator. It is a baseline requirement. The full genre and format breakdown, including consumption data by route type and passenger segment, is in the downloadable report. Airlines building or refreshing their IFE platform will find the catalog benchmarks directly actionable.
Onboard spending: what passengers buy and what stops them
Average onboard spend per passenger stands at $90, projected to reach $120 by 2030 (Valour Consultancy). 26% of airline decision-makers identify building ancillary revenue as their most pressing commercial challenge.
The primary conversion barrier is payment infrastructure. Airlines operating cash or card-only systems are structurally misaligned with where passenger purchasing behavior has moved. A well-configured onboard retail platform that supports digital wallets, loyalty point redemption and multi-option payment at the point of purchase is the gap most airlines are still closing.
The top-selling product categories, the payment preference breakdown through 2027 and the conversion rate benchmarks by airline type are in the full report.
What the data tells airline IFE and commercial teams
Passengers arrive with a smartphone, a streaming habit, and purchasing intent. The cabin has 2 to 12 hours of their attention. What airlines do with that window determines per-passenger yield and shapes the overall passenger experience.
Content catalog depth, device charging access, payment flexibility and a connected retail layer are not independent decisions. They compound. An airline that fixes content but not payment captures less than one that addresses both. The infrastructure is what converts intent into revenue.
The full report covers the complete genre breakdown by route type, passenger demographic segmentation, payment preference trends through 2027 and IFE platform benchmarks. Infographic format. Used by IFE managers, content leads and ancillary revenue teams at airlines evaluating their onboard passenger strategy. Free download.
Discover our latest reports


Ready to redefine your journey with innovative solutions?
Start powering your digital journey with Moment.